Flow Execution and Debugging
The Flow Execution and Debugging environment is where the logic designed in Flow Builder comes to life.
It allows users to run processes manually, inspect their behavior in real time, and verify correctness before connecting them to UI actions or Artoo commands.
In short, it’s both a laboratory and a microscope: you can execute a process, watch how it behaves, and see every transformation that occurs inside.
How Flow Execution Works
When you start a Flow manually from the Builder:
Initialization – The system loads input variables and prepares the DataStore.
Execution – Nodes run sequentially or conditionally, updating variables and DataStore contents step by step.
Observation – The user can track variable changes, inspect in-memory data, and review node outputs in real time.
- doplnit do debuggeru možnost procházet procesem step by step
Finalization – Once the Flow reaches the End Node, results are displayed: output variables, any database changes, and detailed logs.
The production database remains untouched until you explicitly persist data via an End Node.
Execution Panel Overview
The Flow Execution Console in P4 typically provides the following key sections:
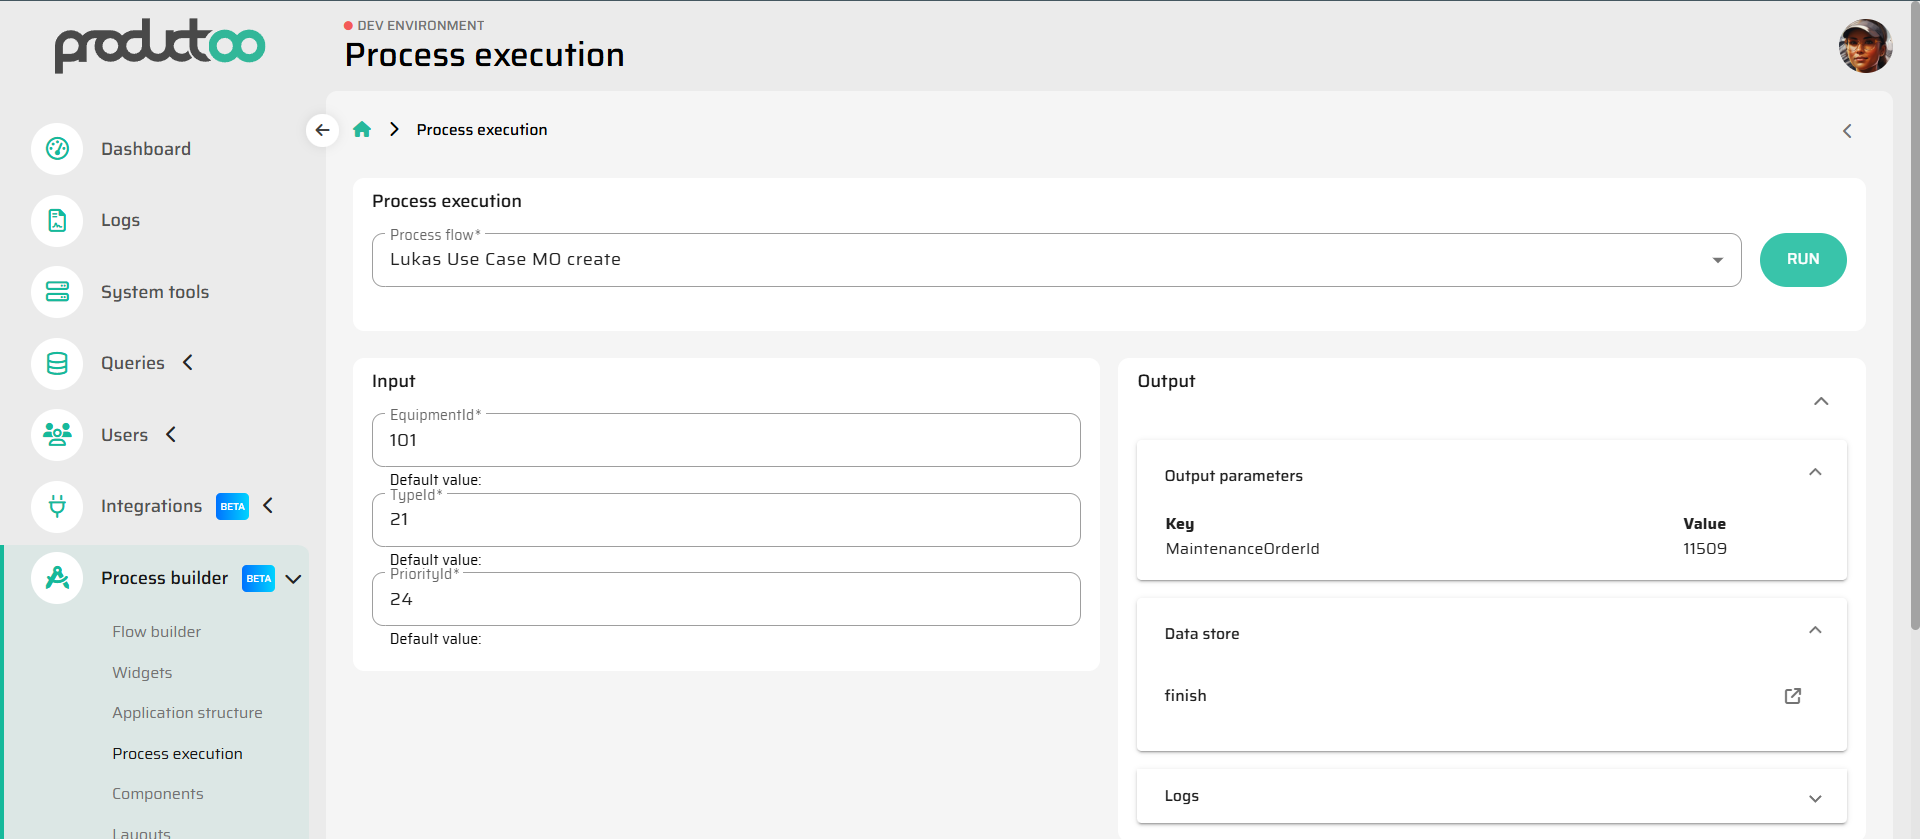
Input Panel:
Displays all declared input variables. You can manually fill them with test values before running the Flow.Output Panel:
Displays the final result: output variables and return data as they would appear to the calling UI, API, or Artoo.DataStore:
Shows the full state of in-memory data after each step — objects loaded, modified, or marked for persistence.Logs:
A chronological record of every node executed, including timestamps, operation details, and status messages.
Together, these tools give complete visibility into the inner workings of the Flow.
Debugging Capabilities
Debugging a Flow is about more than checking if it runs — it’s about understanding why it behaves the way it does.
The execution environment supports several diagnostic actions:
Step-by-step tracing:
You can follow node execution in sequence, seeing how each one modifies variables or the DataStore.Data inspection:
Open the DataStore view to see current in-memory data structures. This helps identify incorrect assignments, missing fields, or logical errors.Error analysis:
When a process fails, the system highlights the node that caused the issue, displays the exception message, and preserves the DataStore snapshot for review.- Debugger - zvýraznění nodu kde došlo k chybě
Variable comparison:
Compare input and output states to validate that transformations work as intended.- Debugger - diff DataStoru před a po nodu
Performance timing:
The log view also measures execution time per node, useful for optimizing complex Flows.- Debugger - performance jednotlivých částí/nodů procesu
This level of transparency makes debugging visual, intuitive, and safe.
Safe Testing Environment
Flows run inside an isolated sandbox — meaning that:
- Debugger - běh debuggeru v izolovaném sandboxu
The DataStore is reset with each execution.
No persistent database writes occur unless the process explicitly reaches an End Node configured for persistence.
You can freely experiment with variable values, branching conditions, or data filters without risk of corrupting live data.
This setup encourages iterative development: design a Flow, run it, observe the result, adjust logic, and test again — all in minutes.
Error Handling and Rollback Behavior
If a Flow encounters an error during execution:
The process halts immediately at the failing node.
All pending data in the DataStore are discarded.
No database changes occur if the End Node wasn’t reached.
The error log captures the exception message, stack trace, and node context.
For transactional Flows, rollback happens automatically at the database level.
This makes it safe to debug even processes that perform complex write operations.
Best Practices
Always run and inspect a new or modified Flow before connecting it to UI or production automation.
Use descriptive node names and variable labels — it makes execution logs much easier to read.
Keep debug sessions short; focus on one branch of logic at a time.
Use sample data sets representative of real production scenarios to catch edge cases early.
Summary
Flow Execution and Debugging is where process design meets reality.
It gives users a safe, transparent environment to test, refine, and understand every step of their logic — from the first input variable to the final database commit.
This visibility is what turns the Process Builder from a no-code tool into a true development environment — one that combines the safety of simulation with the precision of real execution.