Reporting - Production Lead Time
Comment
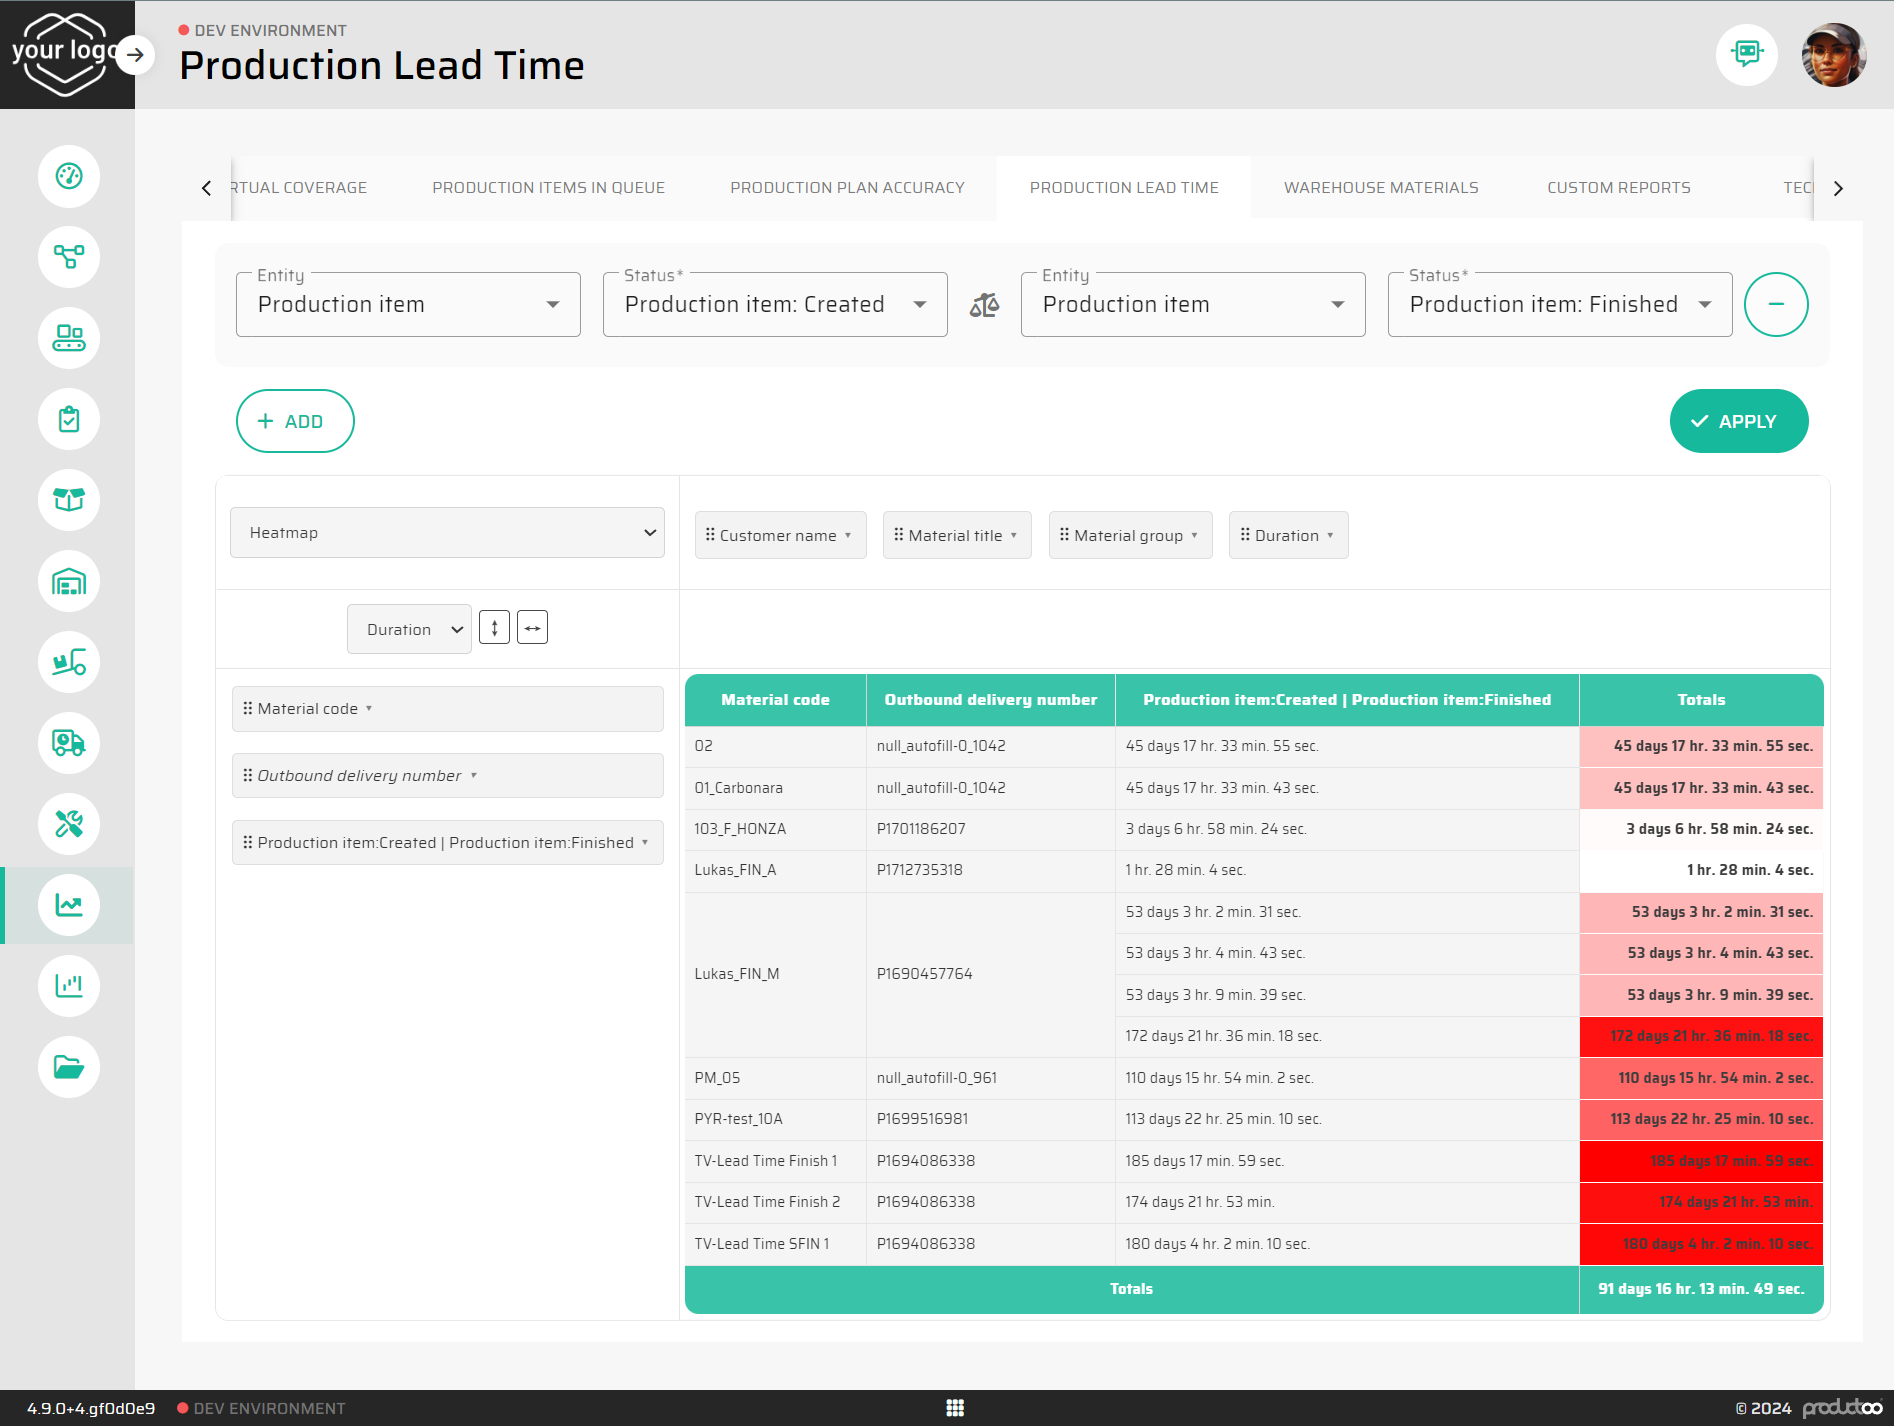
The "Production Lead Time" report in our production planning software is a powerful tool that allows users to analyze the time taken between two critical points in the production and delivery process. This report provides insights into the efficiency and potential bottlenecks within the production pipeline by calculating the average lead time between specified start and end events.

Accessing the Report
Production Control - Reporting: Access the reporting in Production Control module.
Navigate to the Report: On the top menu, select the "Production Lead Time" report.
Setting Up the Report
Step 1: Select Starting Point of the Process
Entity: Choose the entity that marks the beginning of the process. The available entities are:
Production Item: Represents a work order in production.
Outbound Delivery: Represents a customer order.
Outbound Delivery Material: Represents an item in a customer order.
Status: Select the status of the chosen entity at the start of the process. For example, if you choose "Outbound Delivery" as the entity, you might select "Created" as the status.
Step 2: Select Ending Point of the Process
Entity: Choose the entity that marks the end of the process. The available entities are the same as above.
Status: Select the status of the chosen entity at the end of the process. For example, if you choose "Production Item" as the entity, you might select "Finished" as the status.
Step 3: Define Additional Filters (Optional)
You can refine the report by applying additional filters:
Material Code: Filter by specific material codes.
Outbound Delivery Number: Filter by specific outbound delivery numbers.
Customer Name: Filter by customer names.
Material Title: Filter by material titles.
Material Group: Filter by material groups.
Generating the Report
After setting up the starting and ending points, and applying any additional filters, click on the "Apply" button.
The system will filter all relevant production items and calculate the average time between the specified start and end events.
Understanding the Report Output
The report is presented in a pivot table format with the following dimensions:
Material: The specific material involved.
Outbound Delivery: The related outbound delivery order.
Customer: The customer associated with the outbound delivery.
Material Group: The group classification of the material.
Additionally, there is a dimension based on the defined start and finish events, named after the selected process start and finish events (e.g., "Outbound Delivery: Created | Production Item: Finished").
Example
If you choose:
Starting Point: Entity - Outbound Delivery, Status - Created
Ending Point: Entity - Production Item, Status - Finished
The report will:
Filter all production items in the system that are linked to outbound deliveries.
Calculate the average time between when an outbound delivery was created and when its linked production item was finished.
Visual Indicators
The report includes a various types of data visualisation forms like standard pivot table, heatmap or charts to visually represent the data.
Conclusion
The "Production Lead Time" report is a valuable tool for monitoring and analyzing the efficiency of your production process. By understanding the time taken between key events, you can identify areas for improvement and ensure timely delivery of products. Use the filters and dimensions to customize the report according to your specific needs and gain deeper insights into your production performance.
