Skip table of contents

Production items - PC

Reporting production items enables analyzing data about finished production to track and evaluate the performance of production operations. It provides insights into production quantities, status updates, and processing times to support decision-making.

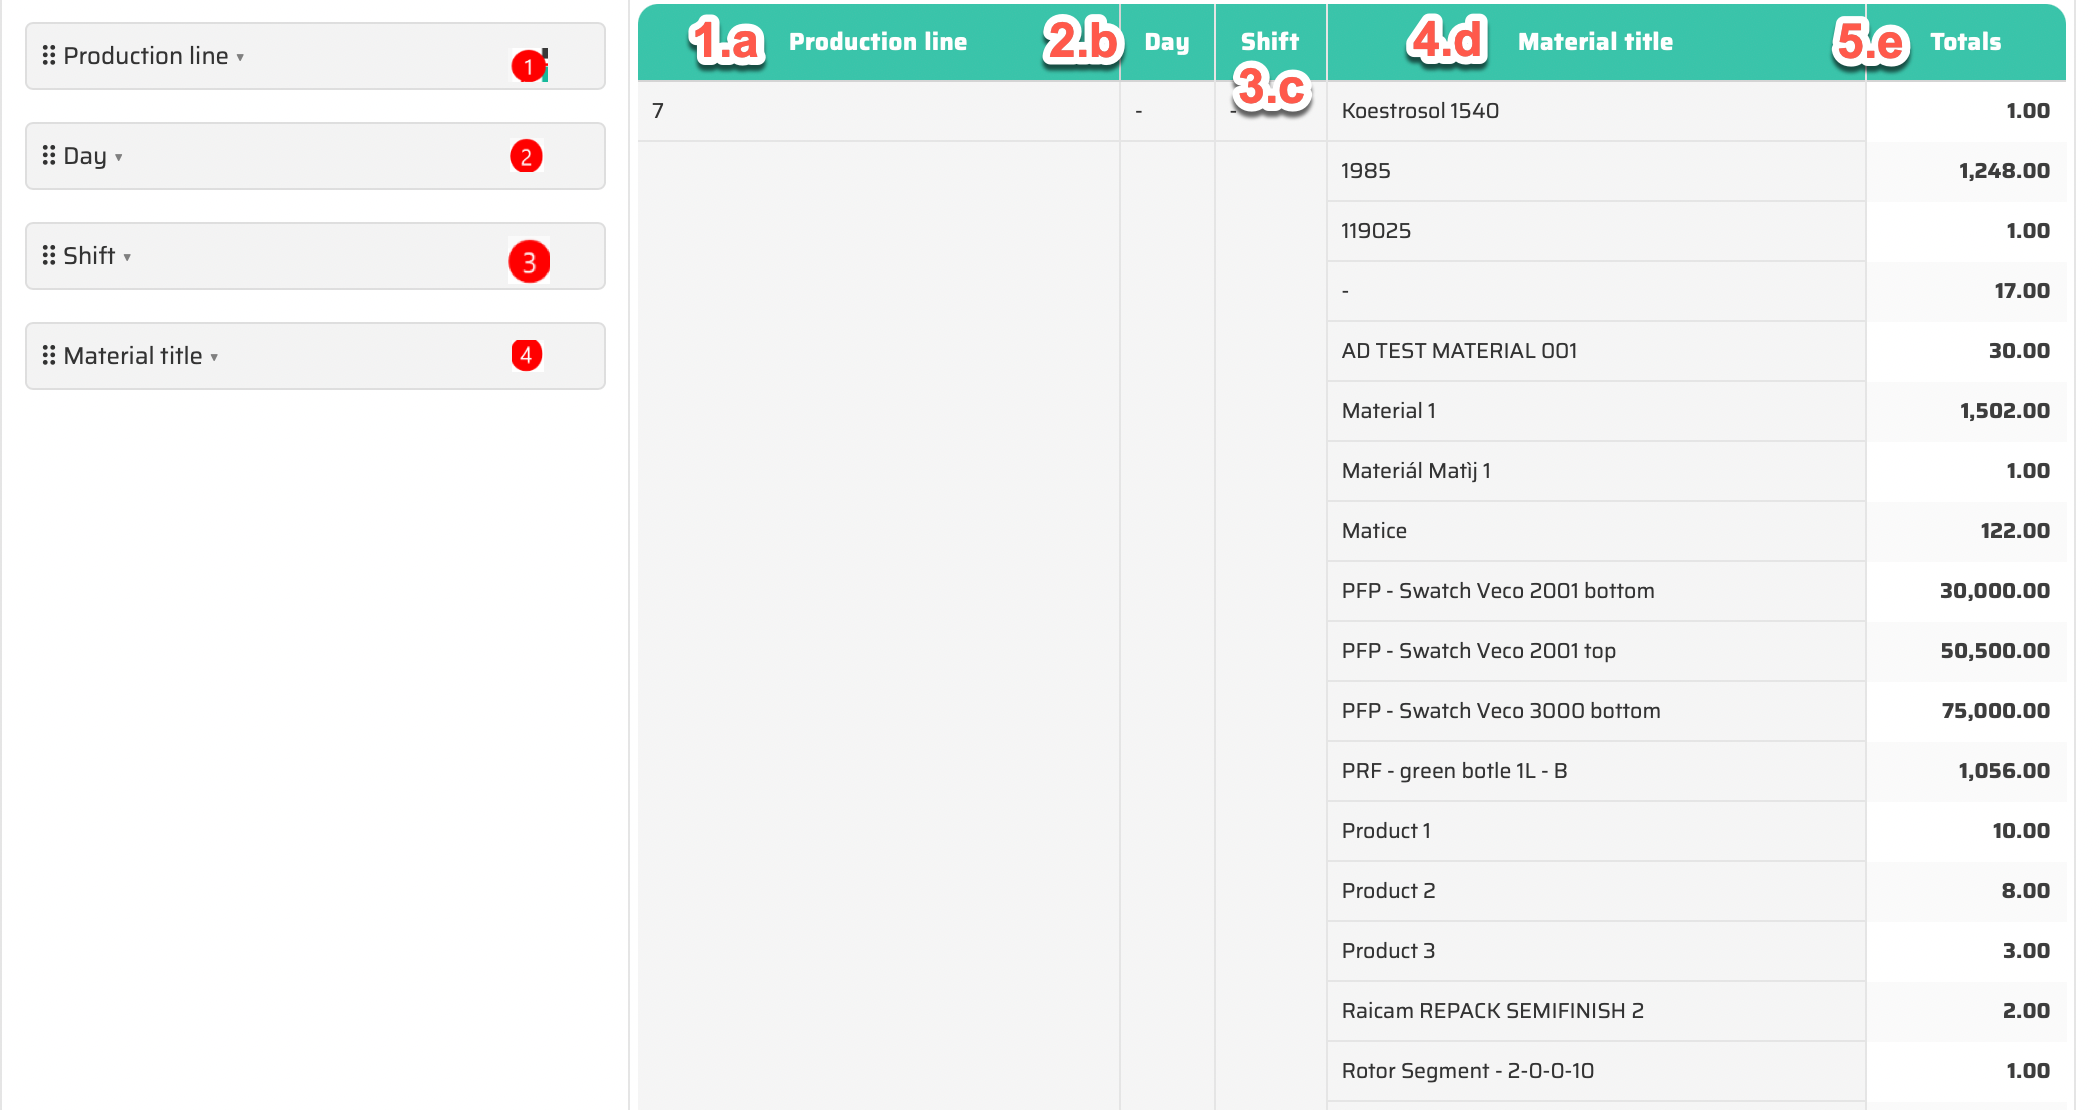
  1. Report type (pivot table, heatmap, charts, …)

  2. Values (Quantity, Quantity in packaging)

  3. List of available data

  4. Selected columns

  5. Selected rows

  6. Report data (based on report type, values, columns and rows)
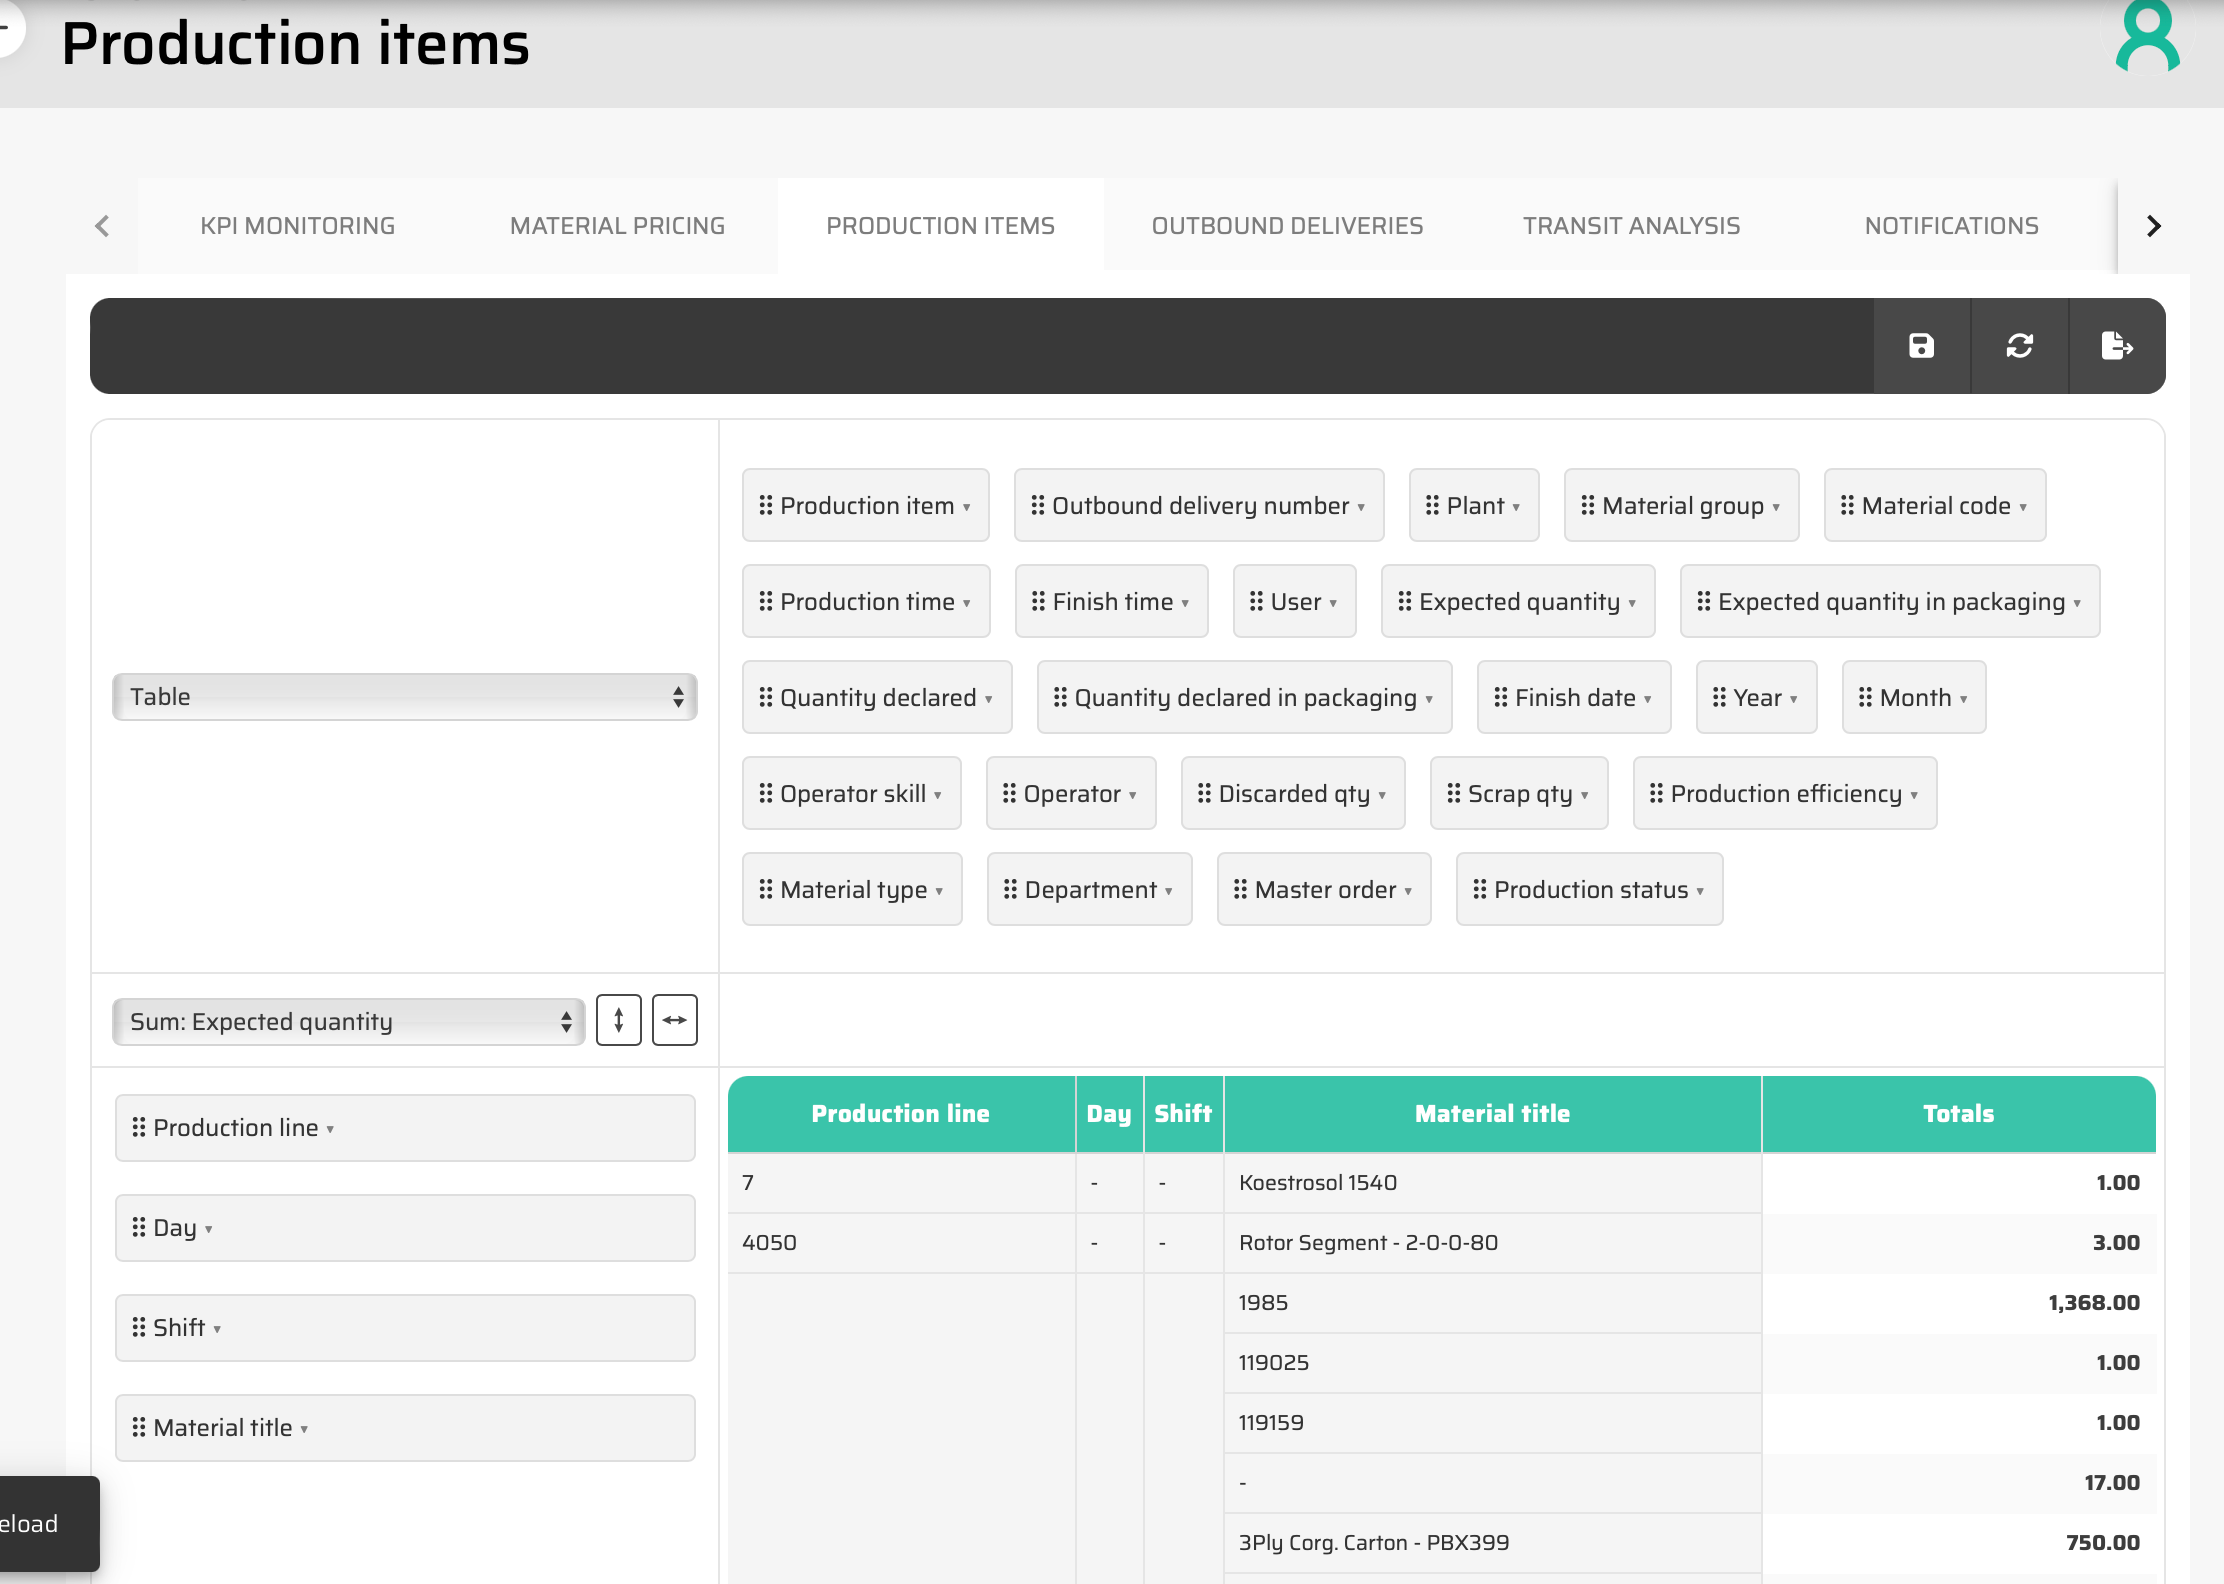
image-20240518-161722.png


Instructions for using

  1. Report can be displayed as the following display types:
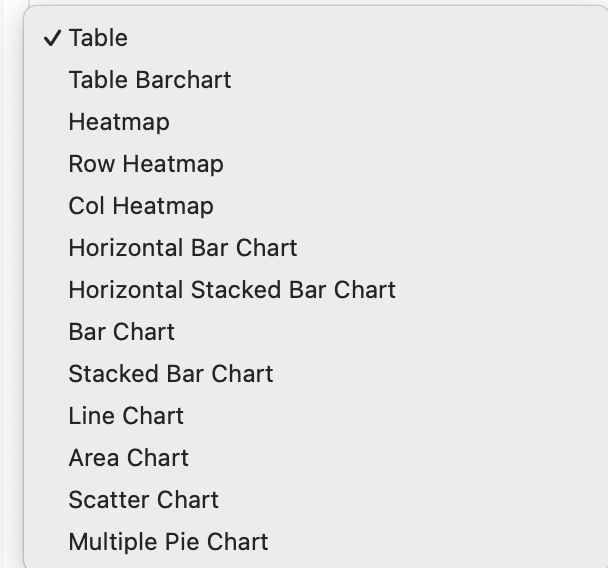
image-20240518-161758.png

2. Values - defines the analysed data values
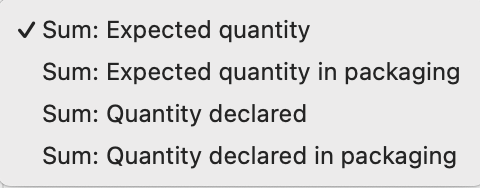
image-20240518-161827.png

3. Columns and rows - by drag&drop select desired columns and rows for the report

Columns

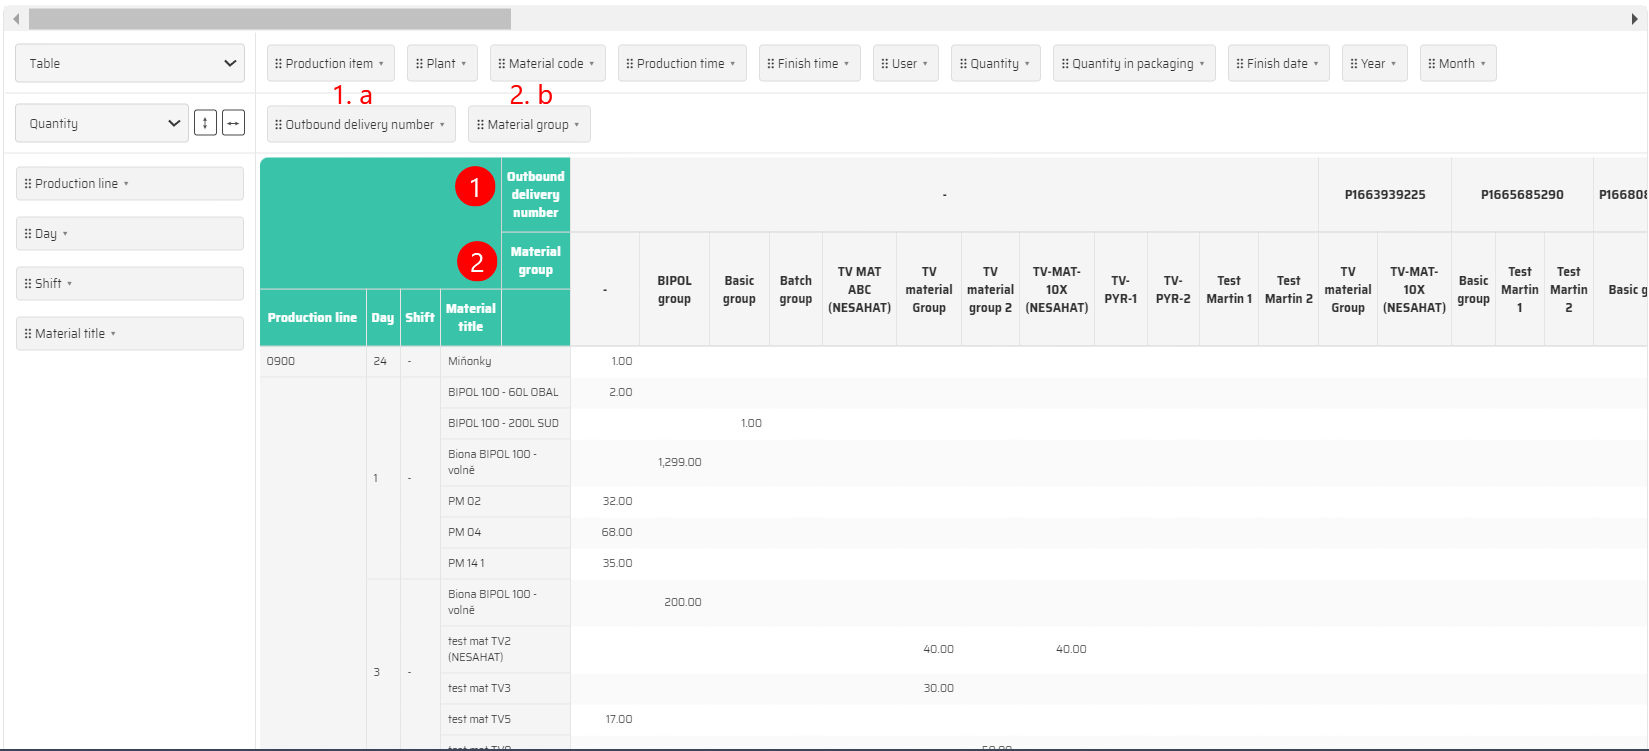
As we can see in the following example, we can use drag and drop to rearrange the information as we want them to be displayed in the table.

image-20240401-135631.png

Rows

Similarly, we can also modify the rows in the same way.

Filtration

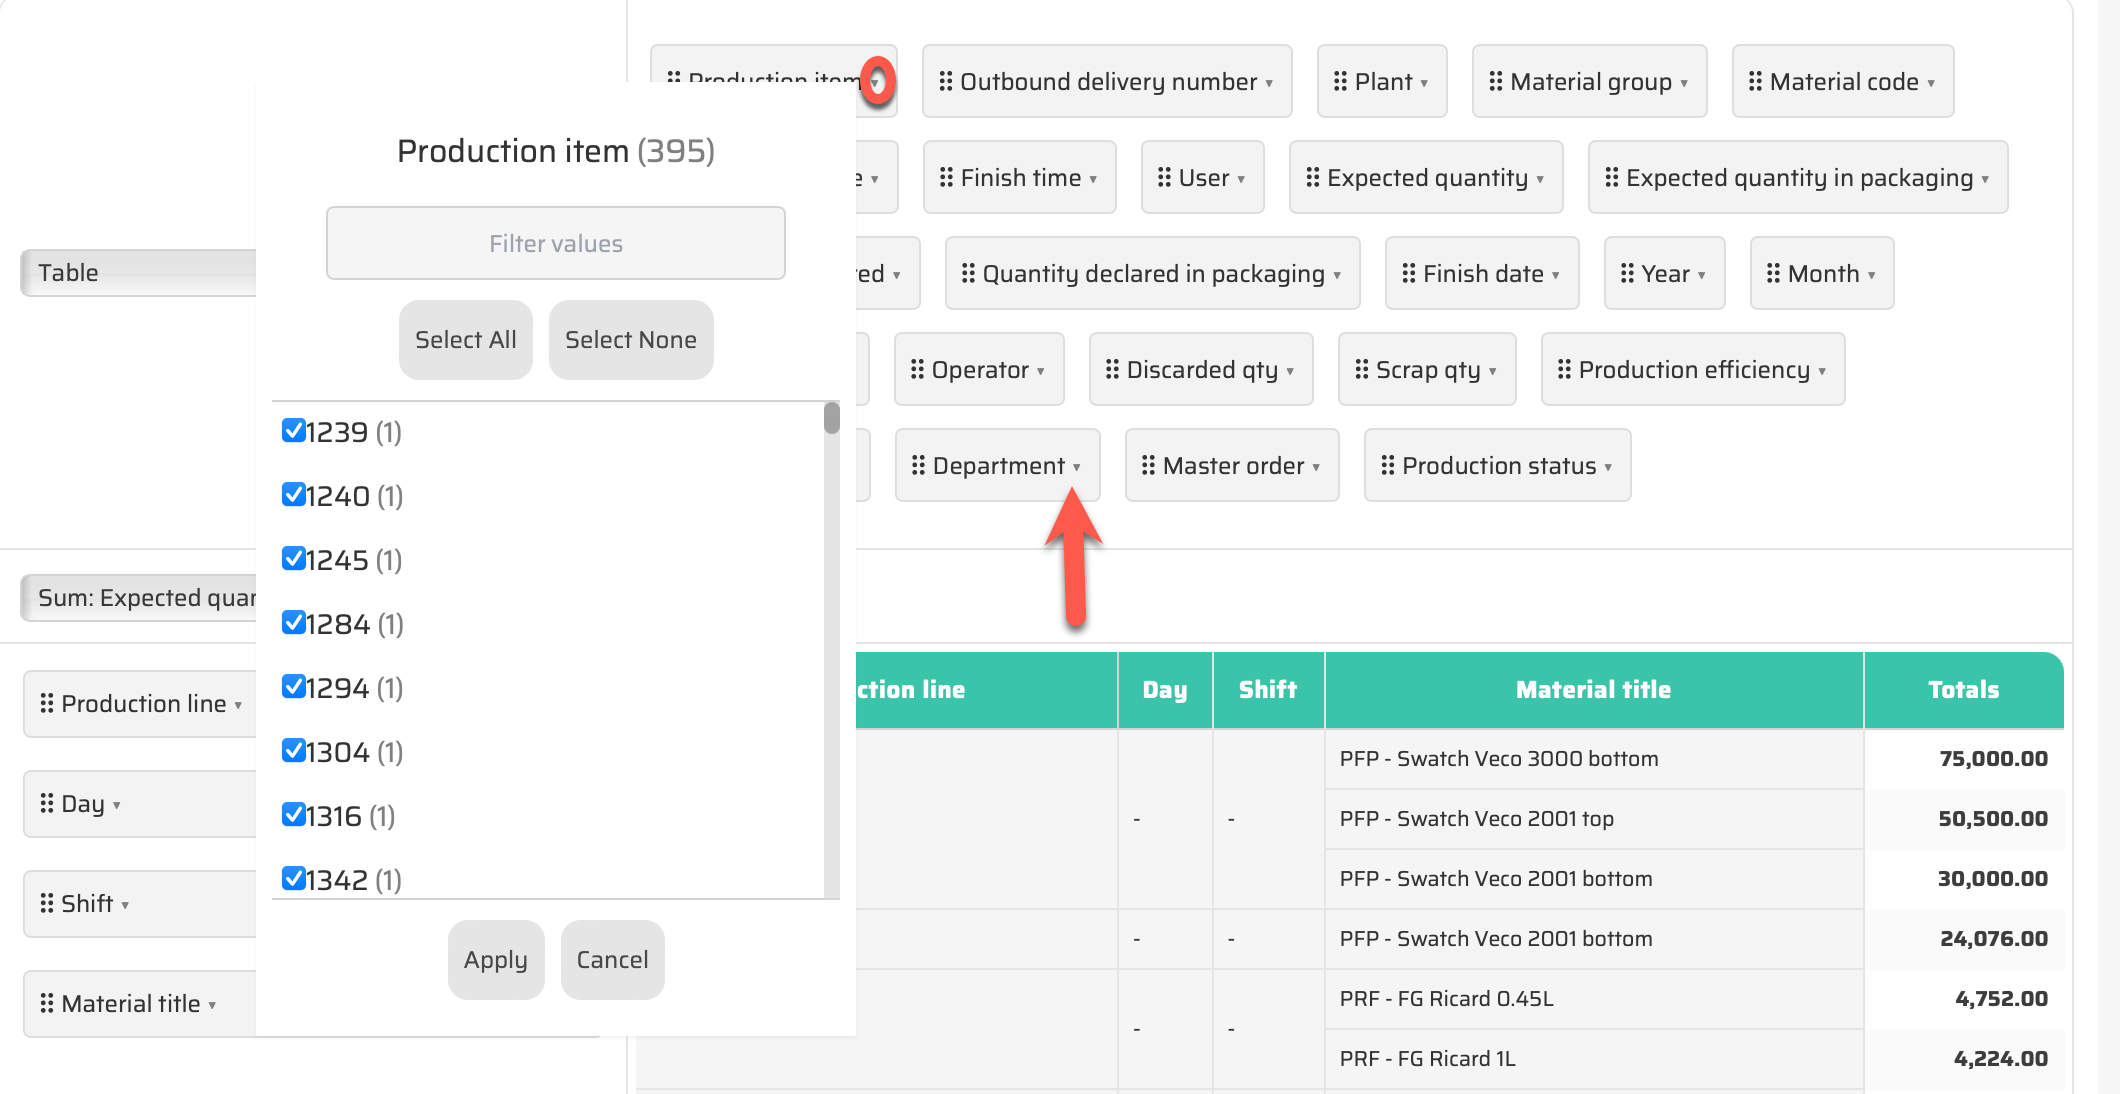
Using a small arrow, we can display filter for each data dimension.

image-20240401-140053.png

Action buttons

This report has following action buttons:

  1. Save current table state - saves current selection of report type, rows, tables and filters named by actual system date and time

  2. Reset table state - restore report to default setting

  3. Export to CSV file

image-20240401-140228.png

JavaScript errors detected

Please note, these errors can depend on your browser setup.

If this problem persists, please contact our support.