OEE
OEE (Overall Equipment Efficiency) is a performance indicator used in production reporting. It measures the level of efficiency and utilization of production equipment and provides information on how well these equipment are utilized and how effectively the production process is running.
OEE is typically calculated based on three key factors: availability, performance, and quality. Each of these factors represents a different aspect of the production process:
Availability: It measures how often the production equipment is available and ready for operation. It takes into account planned and unplanned downtime, such as maintenance, breakdowns, or changeover time.
Performance: It reflects how efficiently the equipment operates at its designed speed. It includes factors such as speed losses, setup time, and performance-related losses during operation.
Quality: It evaluates how well the produced products meet quality standards. It measures factors such as the quantity of defective products, deviations from specifications, etc.
The overall OEE is usually calculated as the product of these three factors, providing an overview of the overall equipment utilization efficiency. OEE is a valuable tool for identifying areas of inefficiency and for improving production processes. By analyzing OEE, one can identify issues, create improvement plans, and monitor progress in achieving production goals.
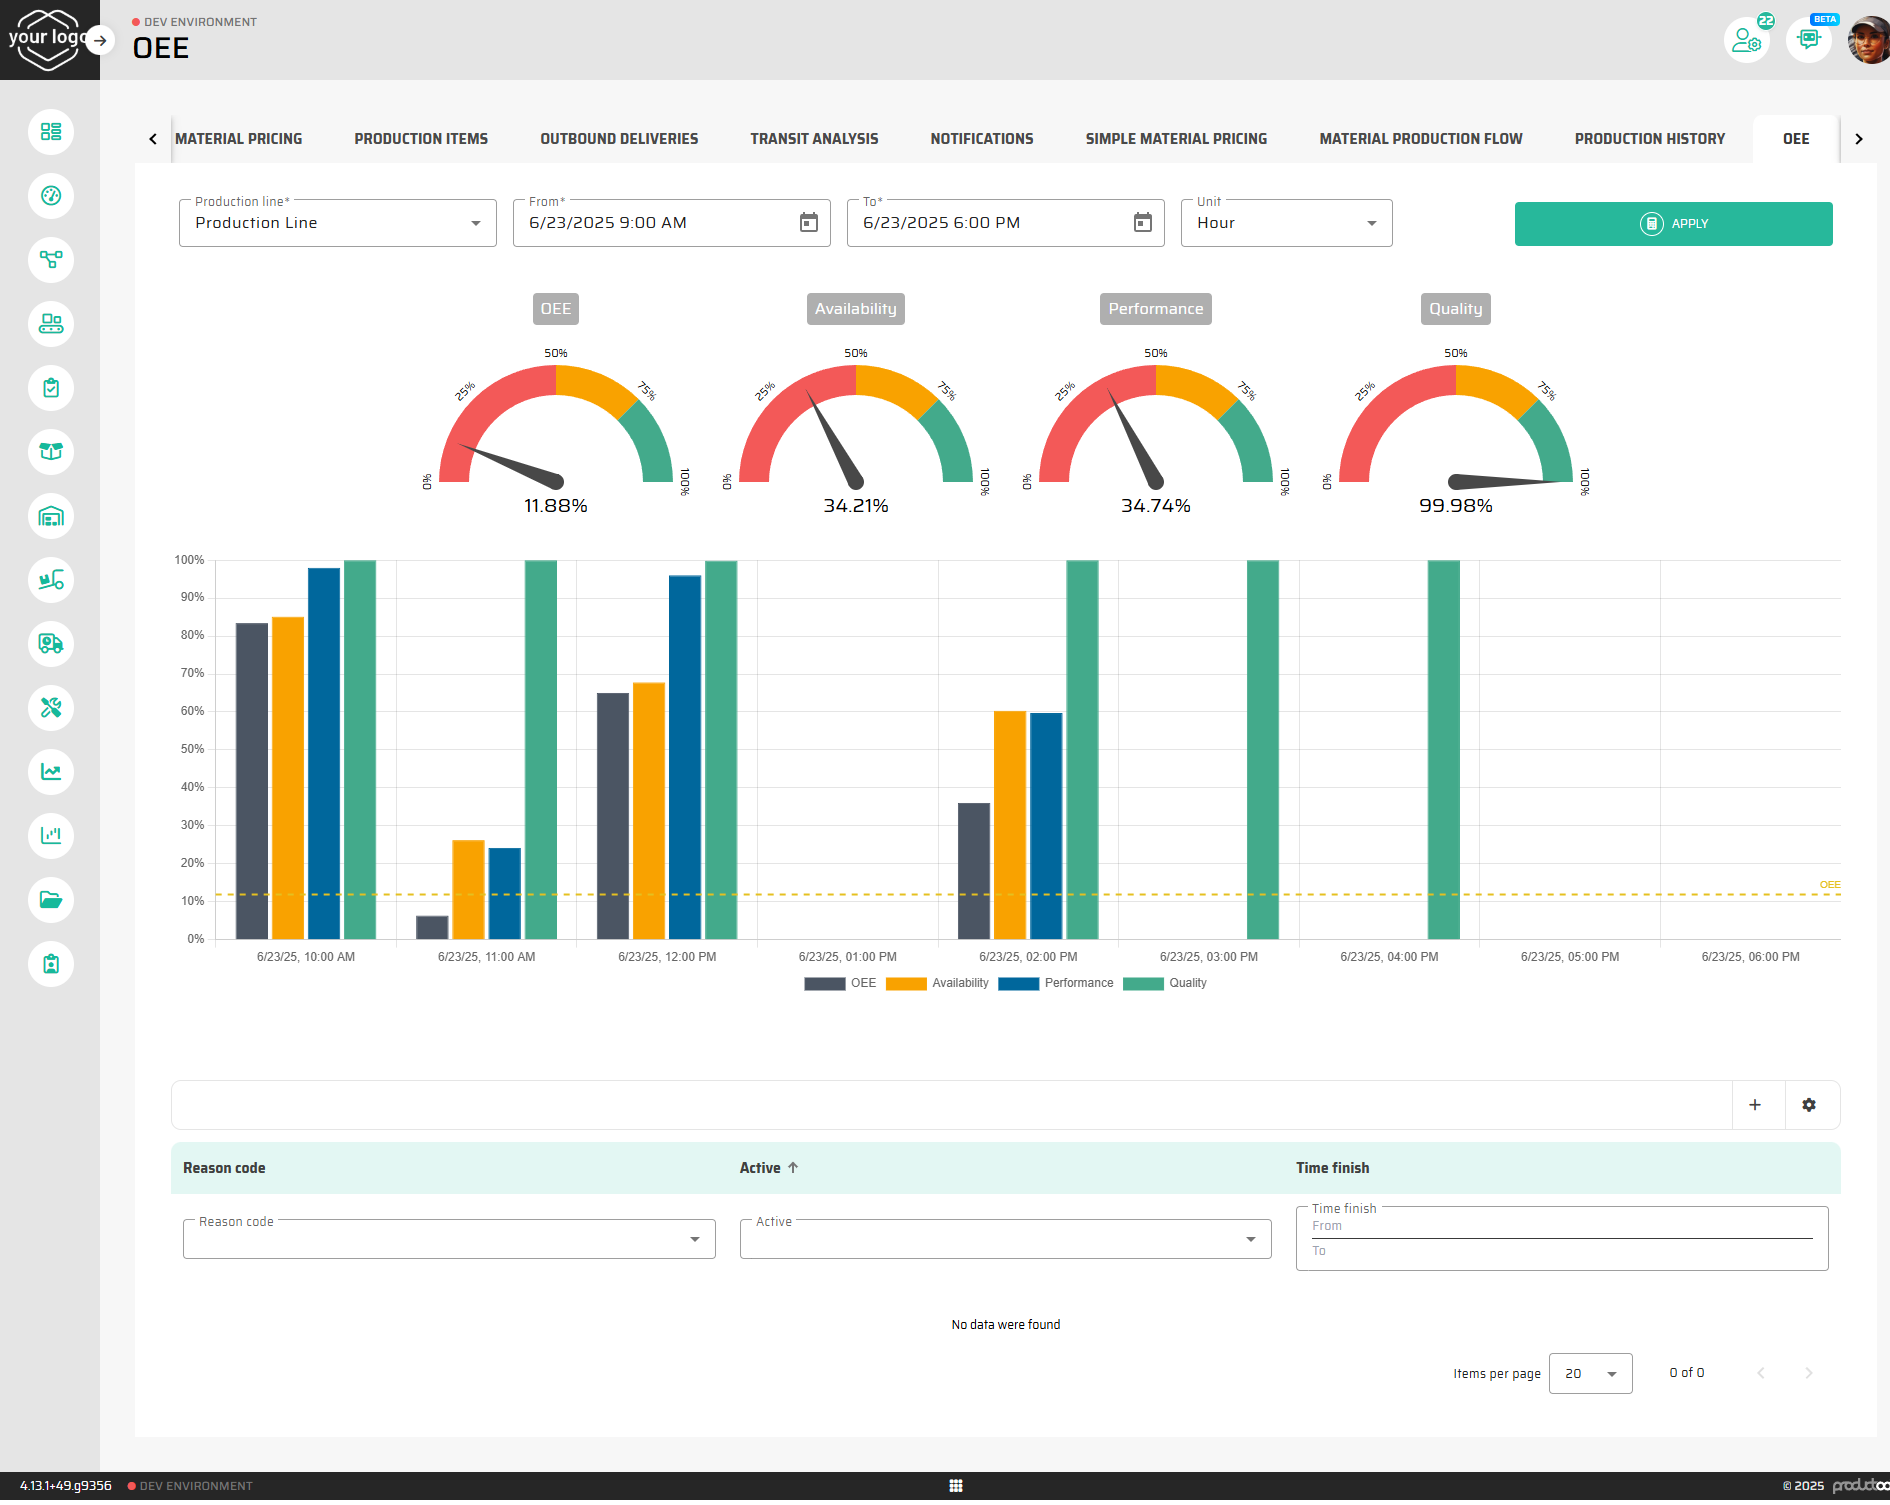
What you see on the screen
Area | What it shows | How to read it quickly |
|---|---|---|
Gauge widgets (top row) | Four speedometer dials for OEE, Availability, Performance, Quality for the selected period. | Red → needs attention, Amber → below target, Green → meets/exceeds target. Keep an eye on which pillar drags OEE down. |
Column chart (middle) | Four bars per time-bucket (grey = OEE, yellow = Availability, blue = Performance, green = Quality). Dashed yellow line = period-average OEE. | Spot spikes or dips in individual pillars. A dip only in blue bars points to speed losses; a dip in yellow bars means stops. |
Line-stoppage table (bottom) | Every unplanned stop that occurred inside the selected window, with reason code and start/finish times. | Sort by Reason Code to identify the biggest Availability killers. |
Why this report matters
Overall Equipment Effectiveness condenses three fundamental questions into one percentage:
Question | OEE Pillar | What it tells you |
|---|---|---|
Was the line available when you needed it? | Availability | Impact of planned vs. unplanned stops |
Did the line run at the planned speed? | Performance | Losses from reduced pace, micro-stops, idling |
Did the line produce good parts? | Quality | Yield, scrap and rework |
Multiplying the three pillars gives OEE. A single number pinpoints how close the line is to its theoretical maximum, while the pillars highlight which loss to attack first.
Where the numbers come from
Step | Source & Logic | End result visible to you |
|---|---|---|
| The system checks each shift calendar and machine signal. It marks every minute as running or stopped. | Availability time and Stoppage time per bucket. |
| Production declarations (good, scrap, discard) are time-stamped. If only total counts are declared, P4 apportions them proportionally across the interval. | Good quantity, Scrap quantity. |
| For each material P4 stores the best-known Minimum Production Time (ideal seconds per part). | Benchmark speed for Performance. |
| Availability = 1 – (stoppage ÷ available time) | |
Performance = (ideal cycle × good qty) ÷ runtime | ||
Quality = good qty ÷ (good + scrap) | ||
| OEE = Availability × Performance × Quality | |
Refresh cadence
All calculations roll up to the last midnight and are recalculated every hour. Granularity (hour / day / 7 d / 30 d) follows the OEE Production Line Interval setting in Admin.
Interpreting & acting on the results
Situation you see | Likely root cause | Typical next step |
|---|---|---|
Low Availability, good Perf & Qual. | Unplanned downtimes, change-overs, missing operators. | Drill into stoppage list, launch RCA, schedule maintenance or SMED activity. |
Low Performance, others ok | Micro–stops, speed restrictions, poor scheduling of mix. | Check shift logs, verify cycle-time standards, balance product mix. |
Low Quality only | Process instability, start-up rejects. | Review scrap codes, tighten quality checks, adjust parameters. |
All pillars healthy but OEE still < target | Very aggressive target, or multiple small losses. | Re-validate theoretical capacity, engage CI team for step-change. |
Benchmarks (rule-of-thumb, discrete manufacturing):
< 60 % – fire-fighting zone, focus on Availability.
60–75 % – improving, address speed losses.
75–85 % – competitive, chase yield.
85 % – world-class, sustain & optimise.
FAQ
Q: Can I see multiple lines side-by-side?
A: Group OEE or multiple line OEE reports is in our pipeline for Q1/2026, now there is only this detail report which focuses on one line for clarity.
Q: How often should I look at hourly OEE?
A: Hourly view is best for short interval control (GO/NO-GO meetings). Daily view is ideal for shift hand-over; weekly for CI workshops.
Q: How is scrap counted in this report?
A: Admins can define if the Quality KPI should calculate only with Scrap, Bad Quantity or both combined so its really up to your preference. Performance measures speed, so it uses all produced parts (good + scrap + discard) against the ideal cycle time. Scrap affects Quality, not Performance.